The purpose of this prototype was simply to ensure the dataset could
be loaded and visualized.
Beta prototype
Question
The question I am trying to answer with this prototype is: Where are
the most dangerous and the safest places in San Francisco to park
your car?
Answer
Using this prototype, I can say that the most dangerous part of San
Francisco to park your car is in the northeastern part of the city.
This is because this part of the city has the highest concentration
of motor vehicle theft and larceny from vehicle.
Encoding
Each circle on the map encodes one police incident of vehicle crime.
The position of the circle on the map is encoding the latitude and
longitude of where this incident occured. The color of the circle is
encoding the incident type. Red is given to motor vehicle thefts
because it is the more extreme and costly crime, while orange is
given to larceny from vehicle because it is less extreme and usually
less costly.
Planned Interactivity
For this visualization, I plan to implement details on demand
interactivity. When the mouse hovers over a circle, a tool tip will
appear which will give more information about that incident. The
tool tip table will include the neighborhood, the exact time and
date, and the description of the incident. When the mouse hovers
over a neighborhood on the basemap, the name of the neighborhood
will be shown. There will also be brushing interactivity so that
when the mouse hovers over an incident, the incidents of the same
type will be more prominent while the incidents of the different
type will fade to the background. Finally, I will include
interactivity which links this map visualization to a second
visualization that will show the trends over time in vehicle crimes
in that neighborhood. When the mouse hovers over an incident in this
visualization, the bar corresponding to the same neighborhood in the
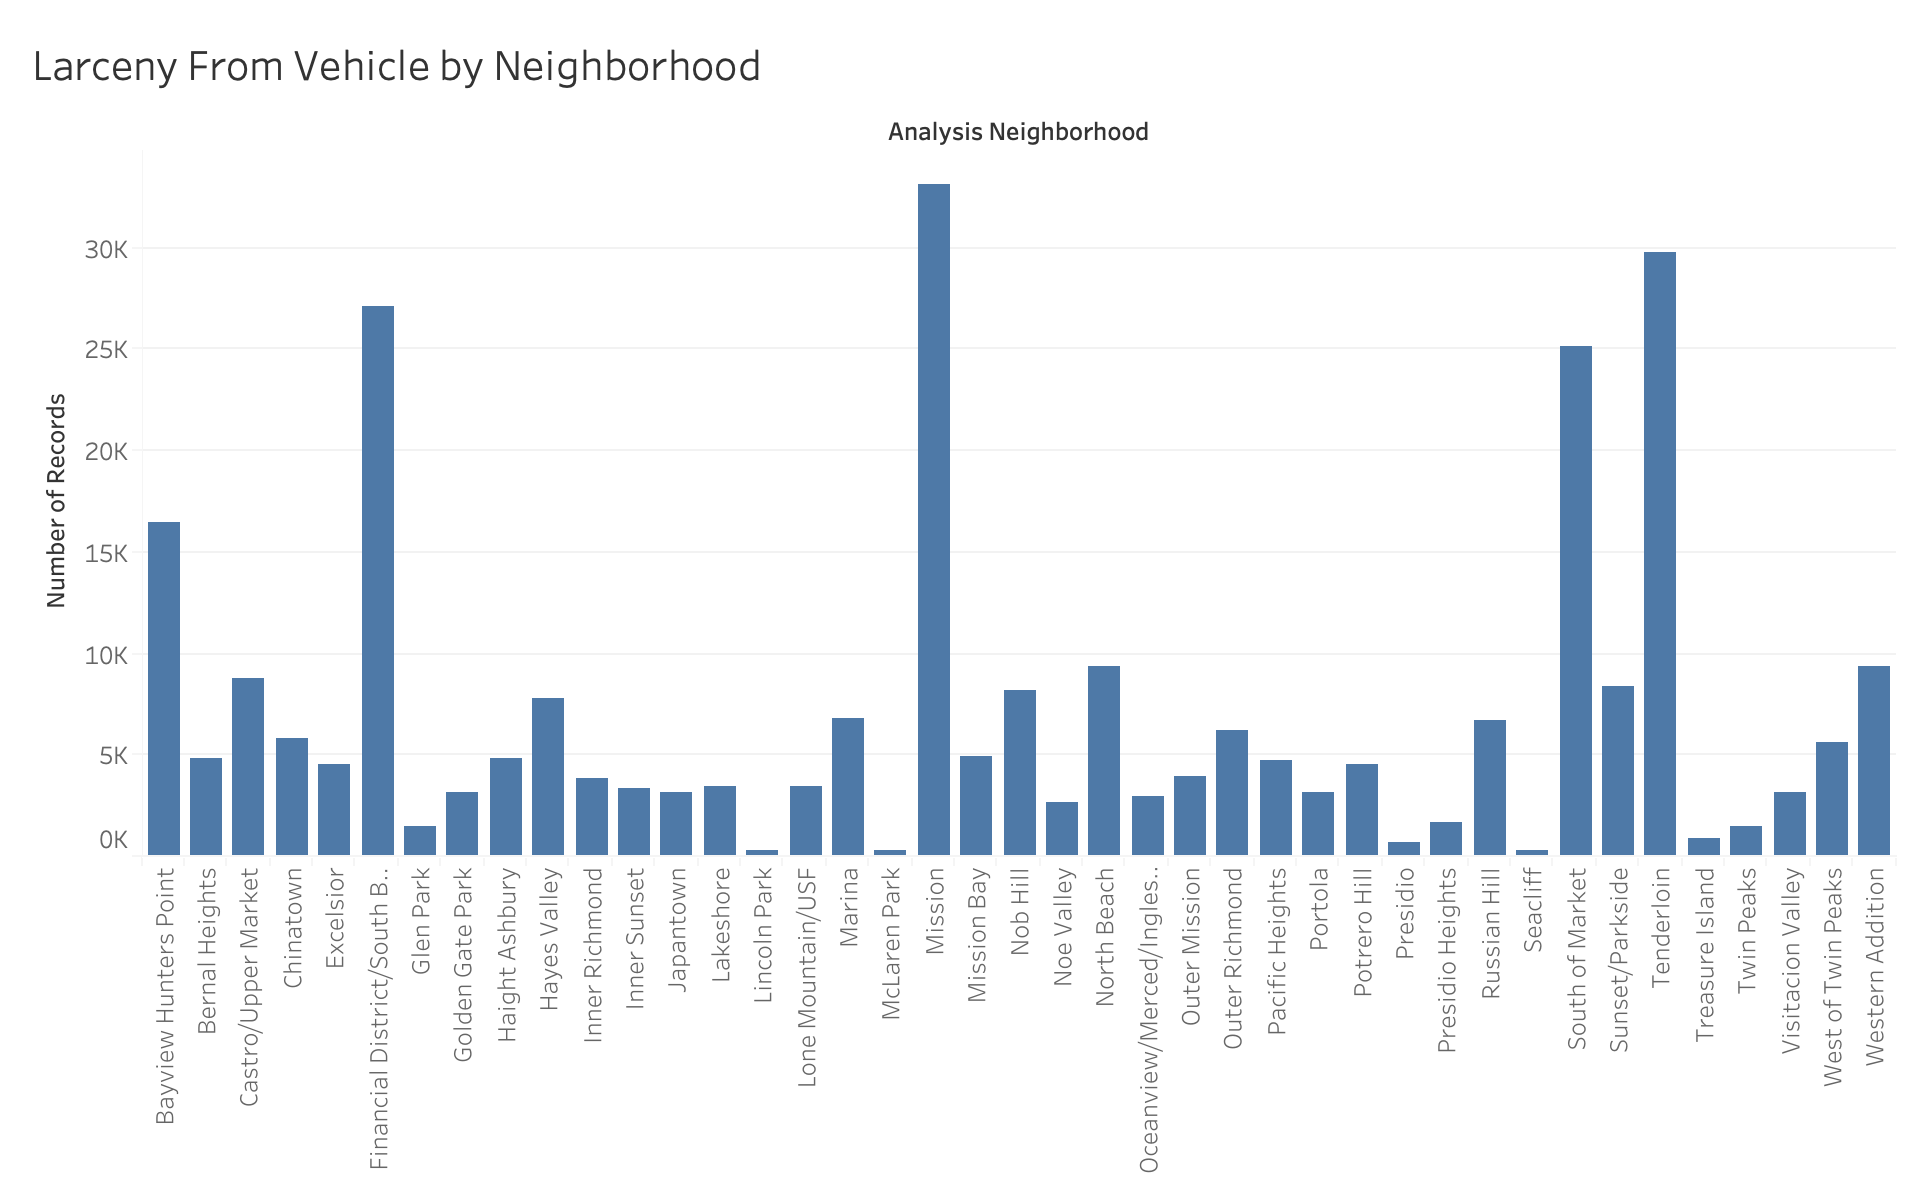
bar chart visualization will be highlighted.
Feedback
Asynchronous Peer Feedback
I recieved feedback on my beta release prototype that the background
color on the map was too bright. I changed my visualization based on
this feedback from the bright blue background color to a white
background color. This is also a better use of gestalt principles by
clearly showing the data in the foreground on a white background. I
recieved feedback on my design and aesthetics that said to update my
website theme from the default template to something more
aesthetically pleasing. I updated my website design based on this
feedback to include better looking colors. I recieved feedback that
the circles I used to represent reports were small and hard to see.
I changed the visualization based on this feedback and increased the
radius of the circles.
Live Instructor Feedback
I recieved feedback from my instructor Sophie Engle to include the
streets of San Francisco in the map visualization to make it easier
to read the map. I updated my visualization based on this feedback
and added the streets to the map. I also recieved a recommendation
for a supplemental visualization of a heatmap to show time data to
go along with the geospatial data of the map visualization. I took
this feedback and implemented a heatmap which shows the number of
incidents of car break ins based on the day and time.
I am a Software Developer and Data Scientist based in San
Francisco. My research interests are in Machine Learning,
Computer Vision, Brain-Computer Interfaces, and Human-Computer
Interaction. I enjoy writing songs, playing basketball,
hiking, and baking.